


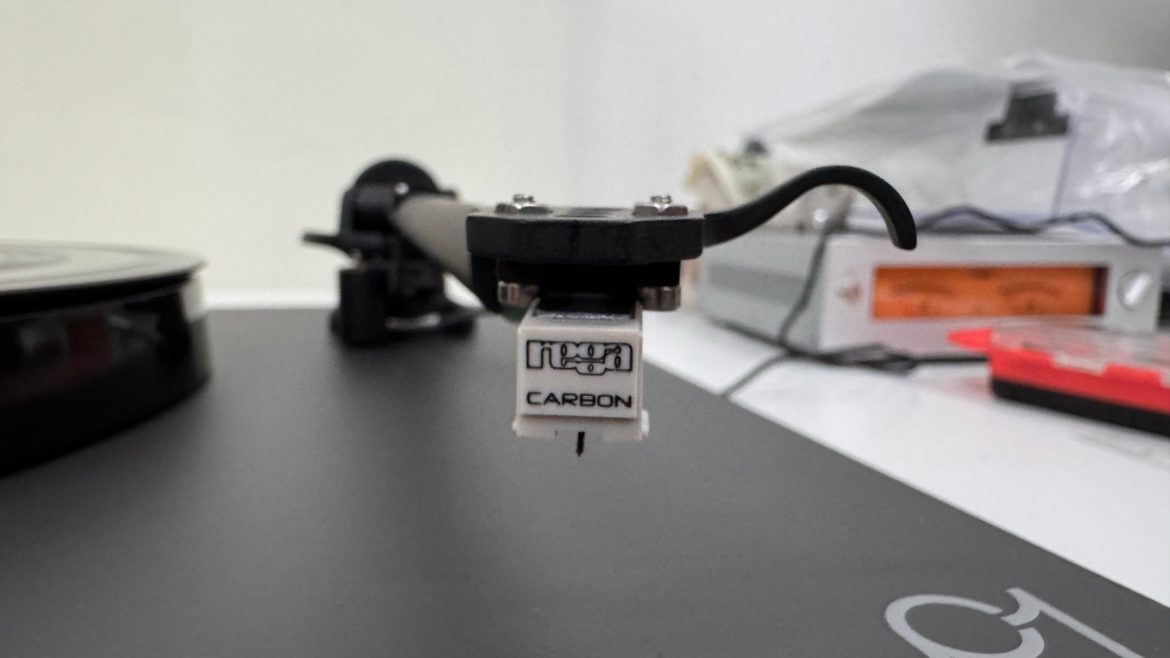
Rega Planar 1 and Carbon Measured: Azimuth and Tracking Force
https://directsoundrecords.com/wp-content/uploads/2026/11/rega-planar-1-carbon-michelangelo-canonico-1024x768.jpg 1024 768 Michelangelo Michelangelo https://secure.gravatar.com/avatar/89c9d8d7e3cacdd3a1530cf562ec5e1b4de2198dbb8a6dd62b550b23ac888854?s=96&d=mm&r=gDSR Technical Journal · Measurement case study
Rega Planar 1 and Carbon Measured
Azimuth adjustment, tracking force and the performance of an affordable vinyl playback system
A thin shim and an extra half-gram of tracking force changed two different aspects of this Rega Planar 1’s measured performance. The azimuth adjustment brought the two crosstalk directions much closer together; the separate increase from 2 g to 2.5 g substantially reduced distortion on demanding tracking-test bands. The standard Carbon cartridge stayed in place throughout.
That is a useful starting point for a review of an entry-level turntable. Before considering a cartridge upgrade, I wanted to establish what the supplied combination was doing, which adjustments produced a worthwhile change, and where its limits remained. These measurements, made on the sample available at the show, provide a practical case study rather than a ranking of complete turntables.
The system and the measurement chain
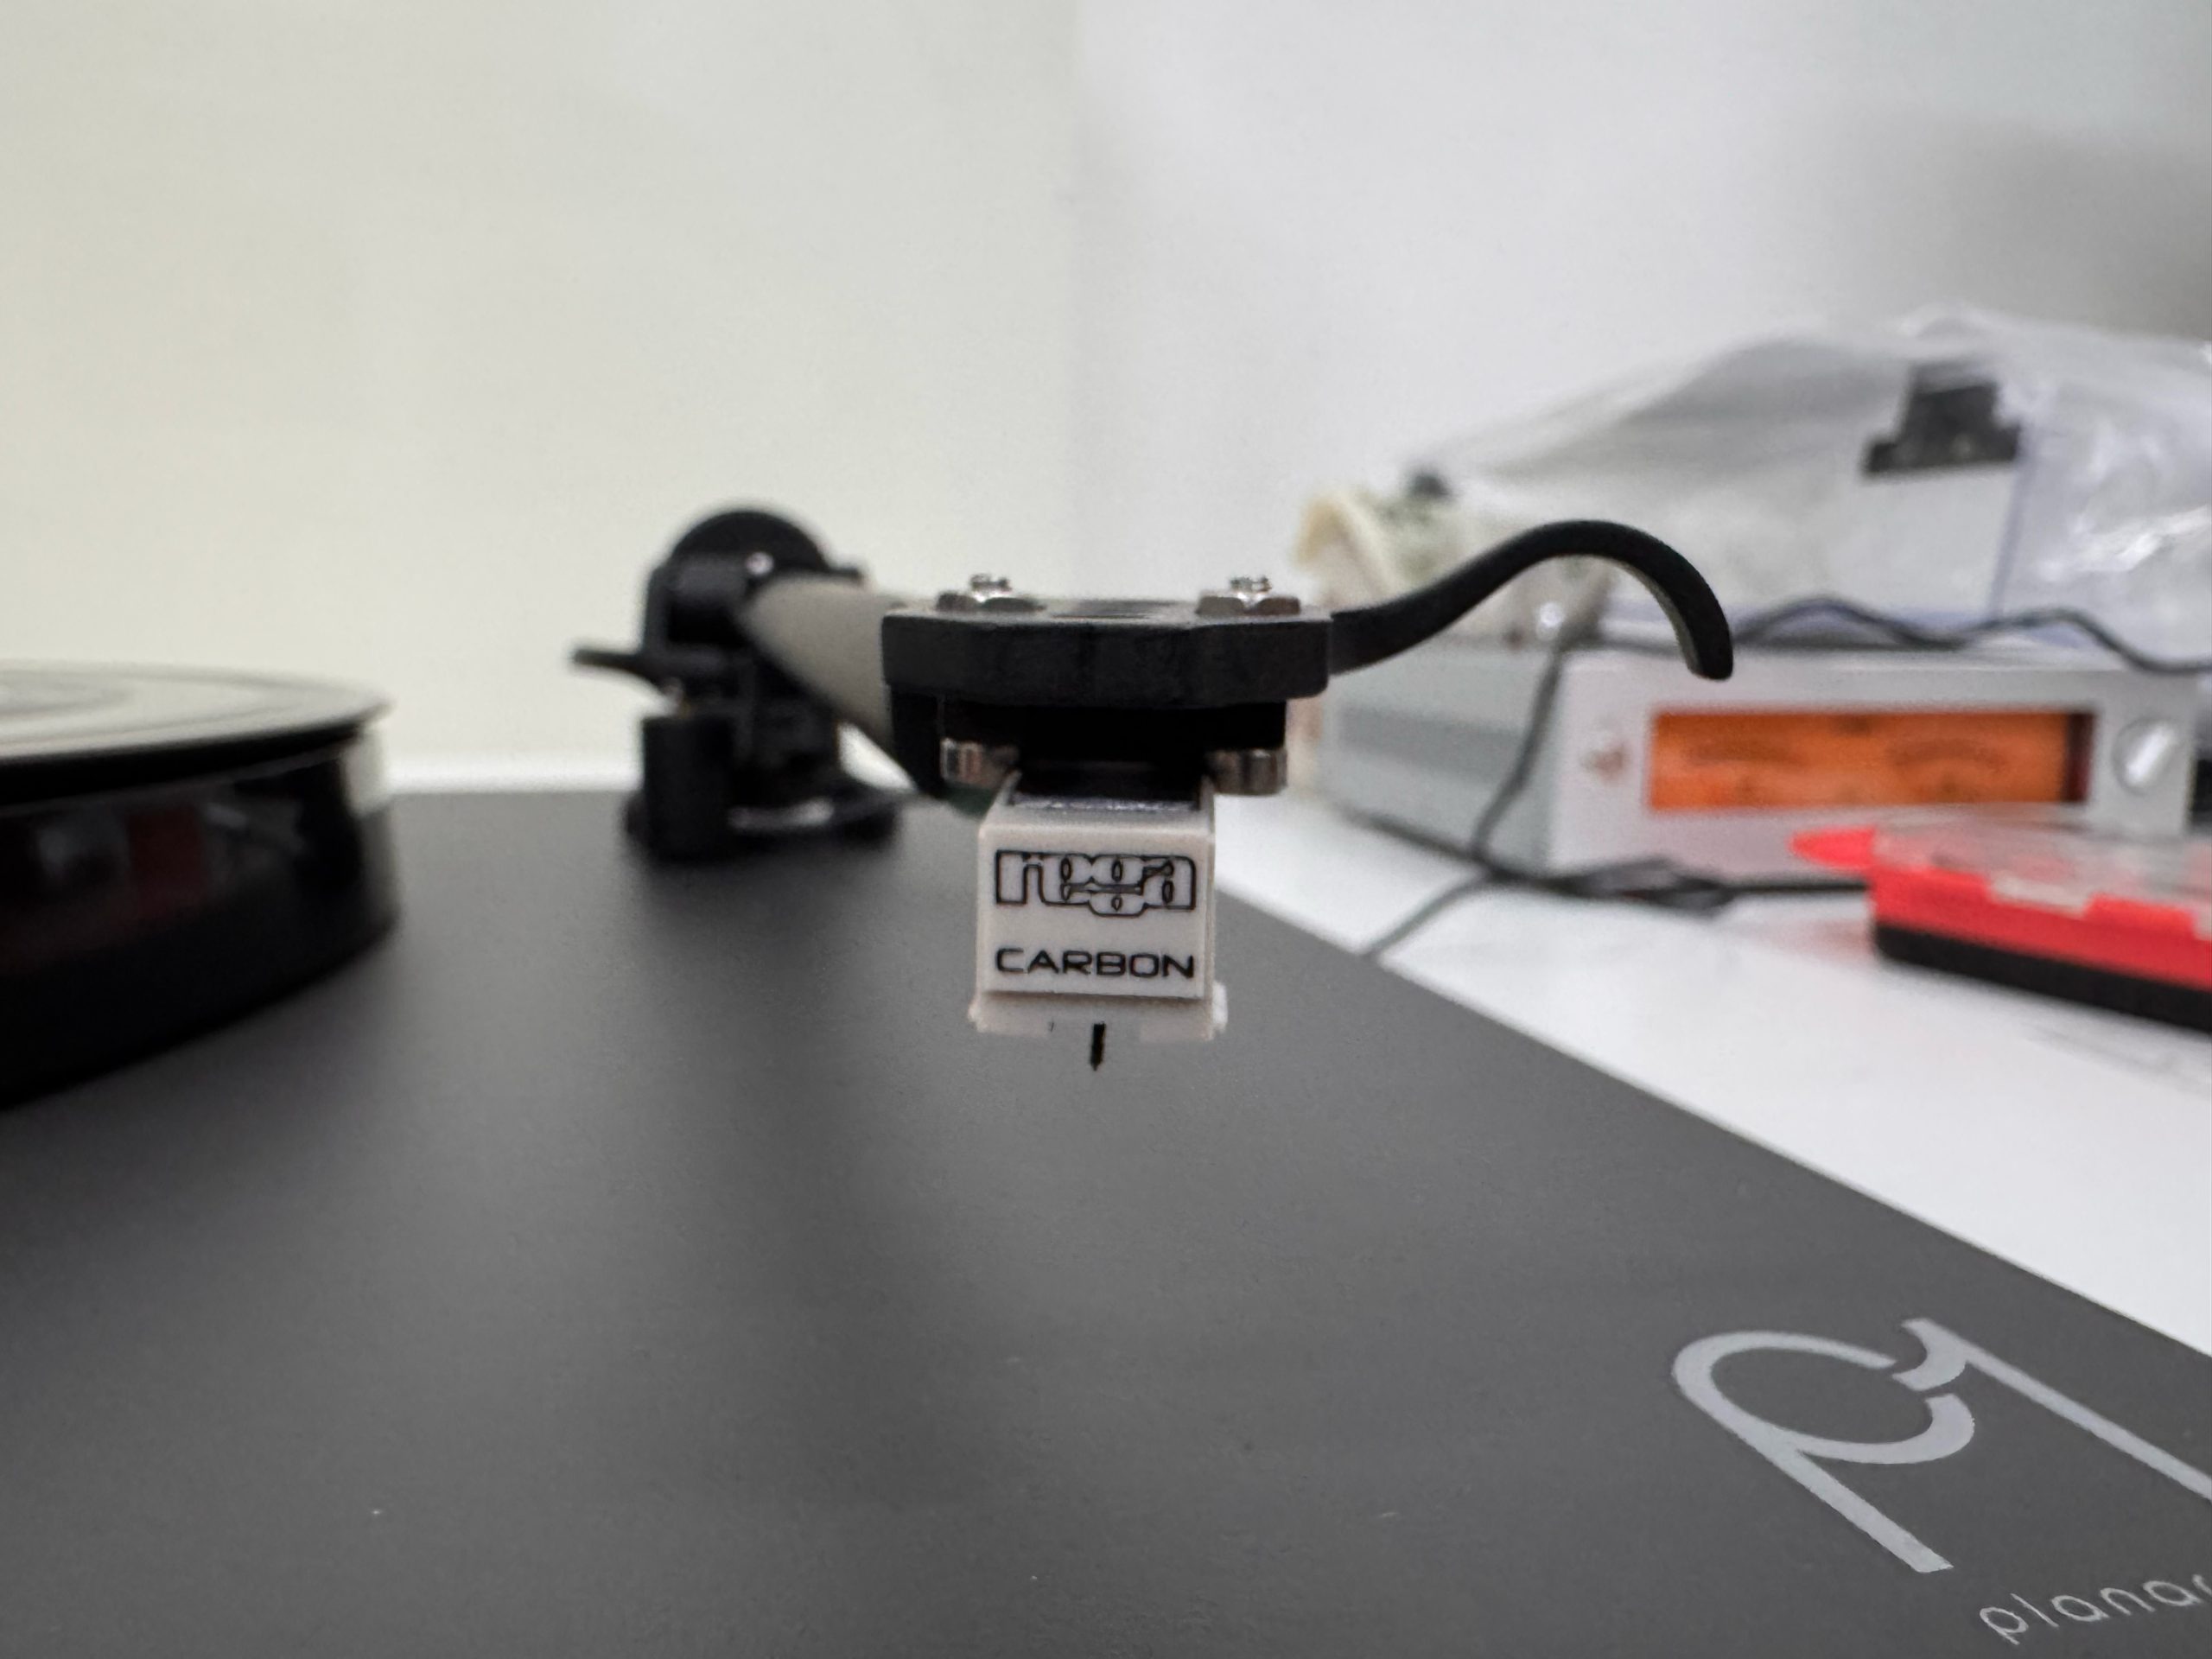
The Planar 1 combines belt drive, a 24 V synchronous motor, a phenolic-resin platter and Rega’s RB110 tonearm. The supplied Carbon is a moving-magnet cartridge with a replaceable conical stylus. Rega specifies an output of 2.5 mV at 1 kHz and a tracking-force range of 2–3 g. Both settings used in the tracking comparison fall within that range.
The original Rega cables fed an ART USB Phono Plus, set to PHONO with LOW CUT switched off. Captures used 48 kHz sampling. Groove Scope on the iPhone supplied the before-and-after channel measurements; Groove Scope Studio supplied the frequency sweep, tracking comparison and more detailed rotational analysis.
The important distinction is that the captured signal includes the test record, cartridge, arm, turntable, cables, phono stage and conversion path. Interpreting that complete chain correctly is part of making a useful measurement.
Azimuth at 2 g before and after the shim
I repeated the left-only and right-only 1 kHz reference tracks before and after inserting a thin shim on the left side of the cartridge mounting. Tracking force was 2 g for this comparison. The shim’s thickness and the resulting physical angle were not recorded, so the reproducible target here is the measured electrical behaviour, rather than a prescribed spacer dimension.
| Measurement at 1 kHz | Before adjustment | After adjustment |
|---|---|---|
| L → R crosstalk | −33.58 dB | −32.13 dB |
| R → L crosstalk | −23.72 dB | −31.77 dB |
| Difference between directions | 9.86 dB | 0.36 dB |
| Mean separation | 28.65 dB | 31.95 dB |
| Output balance L−R | +0.76 dB | +0.72 dB |
| Left THD | 1.264% | 1.251% |
| Right THD | 1.730% | 1.955% |
Crosstalk is shown as a negative ratio relative to the wanted signal; more negative means less leakage. Mean separation is the arithmetic mean of the two positive separation values in dB.
The weaker direction, right to left, improved by 8.05 dB. Left-to-right isolation fell by 1.45 dB, while mean separation increased by 3.30 dB. The unwanted signal in the initially weaker direction dropped from approximately 6.5% to 2.6% of the wanted signal’s amplitude. This was a substantial practical improvement in the sample’s channel isolation.
Output balance changed very little. The nearly equal channel levels had not revealed the much larger asymmetry in crosstalk. That is why I treat level balance and directional separation as separate setup checks.
The distortion results also matter. Left-channel THD remained near 1.25%, while the right rose from approximately 1.73% to 1.96%. The adjustment improved the separation result; it did not improve every measured parameter. The archive also flags variability in the left harmonic measurements, so small THD differences deserve repeated captures before they guide a setup decision.
This pair of acquisitions documents a useful outcome on this sample. It does not establish the repeatability of the change, and electrical crosstalk symmetry does not by itself establish ideal stylus contact geometry. The wider explanation of these distinctions is in my azimuth and crosstalk article.
Tracking at 2 g and 2.5 g
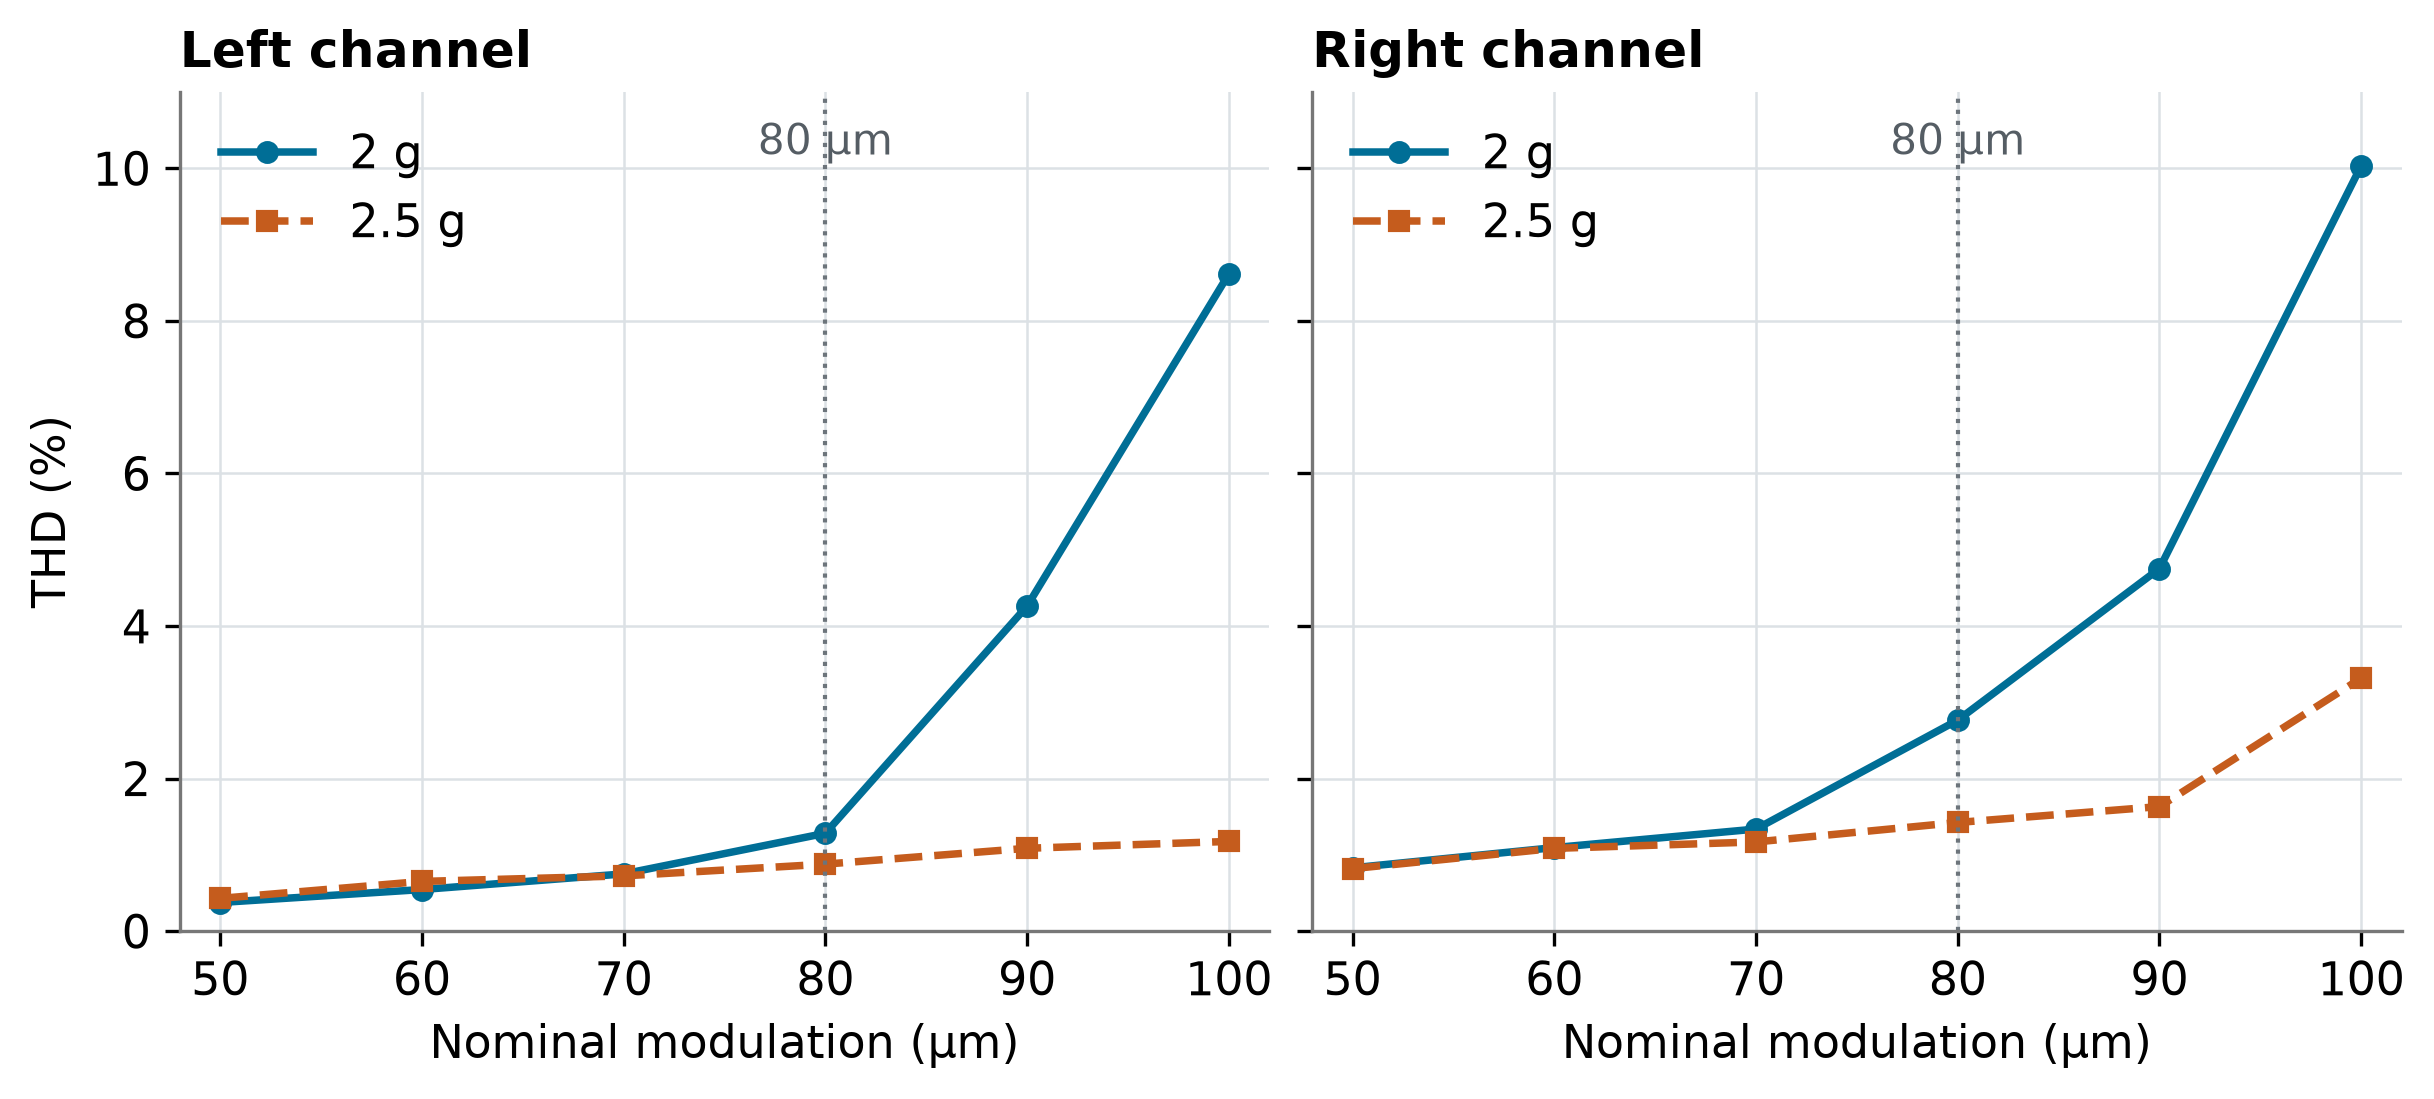
The separate tracking tests used six nominal lateral-modulation steps, from 50 to 100 µm, with a measured fundamental near 314 Hz. Increasing the force to 2.5 g made the largest difference on the more demanding bands.
| Modulation | 2 g left | 2 g right | 2.5 g left | 2.5 g right |
|---|---|---|---|---|
| 50 µm | 0.375% | 0.830% | 0.430% | 0.820% |
| 60 µm | 0.546% | 1.095% | 0.652% | 1.085% |
| 70 µm | 0.750% | 1.338% | 0.724% | 1.169% |
| 80 µm | 1.283% | 2.766% | 0.878% | 1.425% |
| 90 µm | 4.261% | 4.753% | 1.086% | 1.633% |
| 100 µm | 8.614% | 10.032% | 1.176% | 3.316% |
At 80 µm, right-channel THD fell from 2.77% to 1.42%; at 90 µm it fell from 4.75% to 1.63%. At 100 µm, the left result fell from 8.61% to 1.18% and the right from 10.03% to 3.32%. The extra force clearly helped the cartridge maintain its behaviour under stronger modulation.
In my assessment of the 2.5 g test, tracking error began at 80 µm. I therefore treat 80 µm as the practical maximum for this sample, coinciding with the onset of difficulty. The lower distortion figures at 90 and 100 µm do not extend that limit or establish error-free tracking at those levels.
There was little benefit at the lowest steps, and left-channel distortion increased slightly at 50 and 60 µm. The lesson is to check the demanding bands as well as the easy ones. The 2.5 g setting was useful here and remained within Rega’s specified range; its suitability for another cartridge or sample would need its own assessment.
Speed and wow and flutter
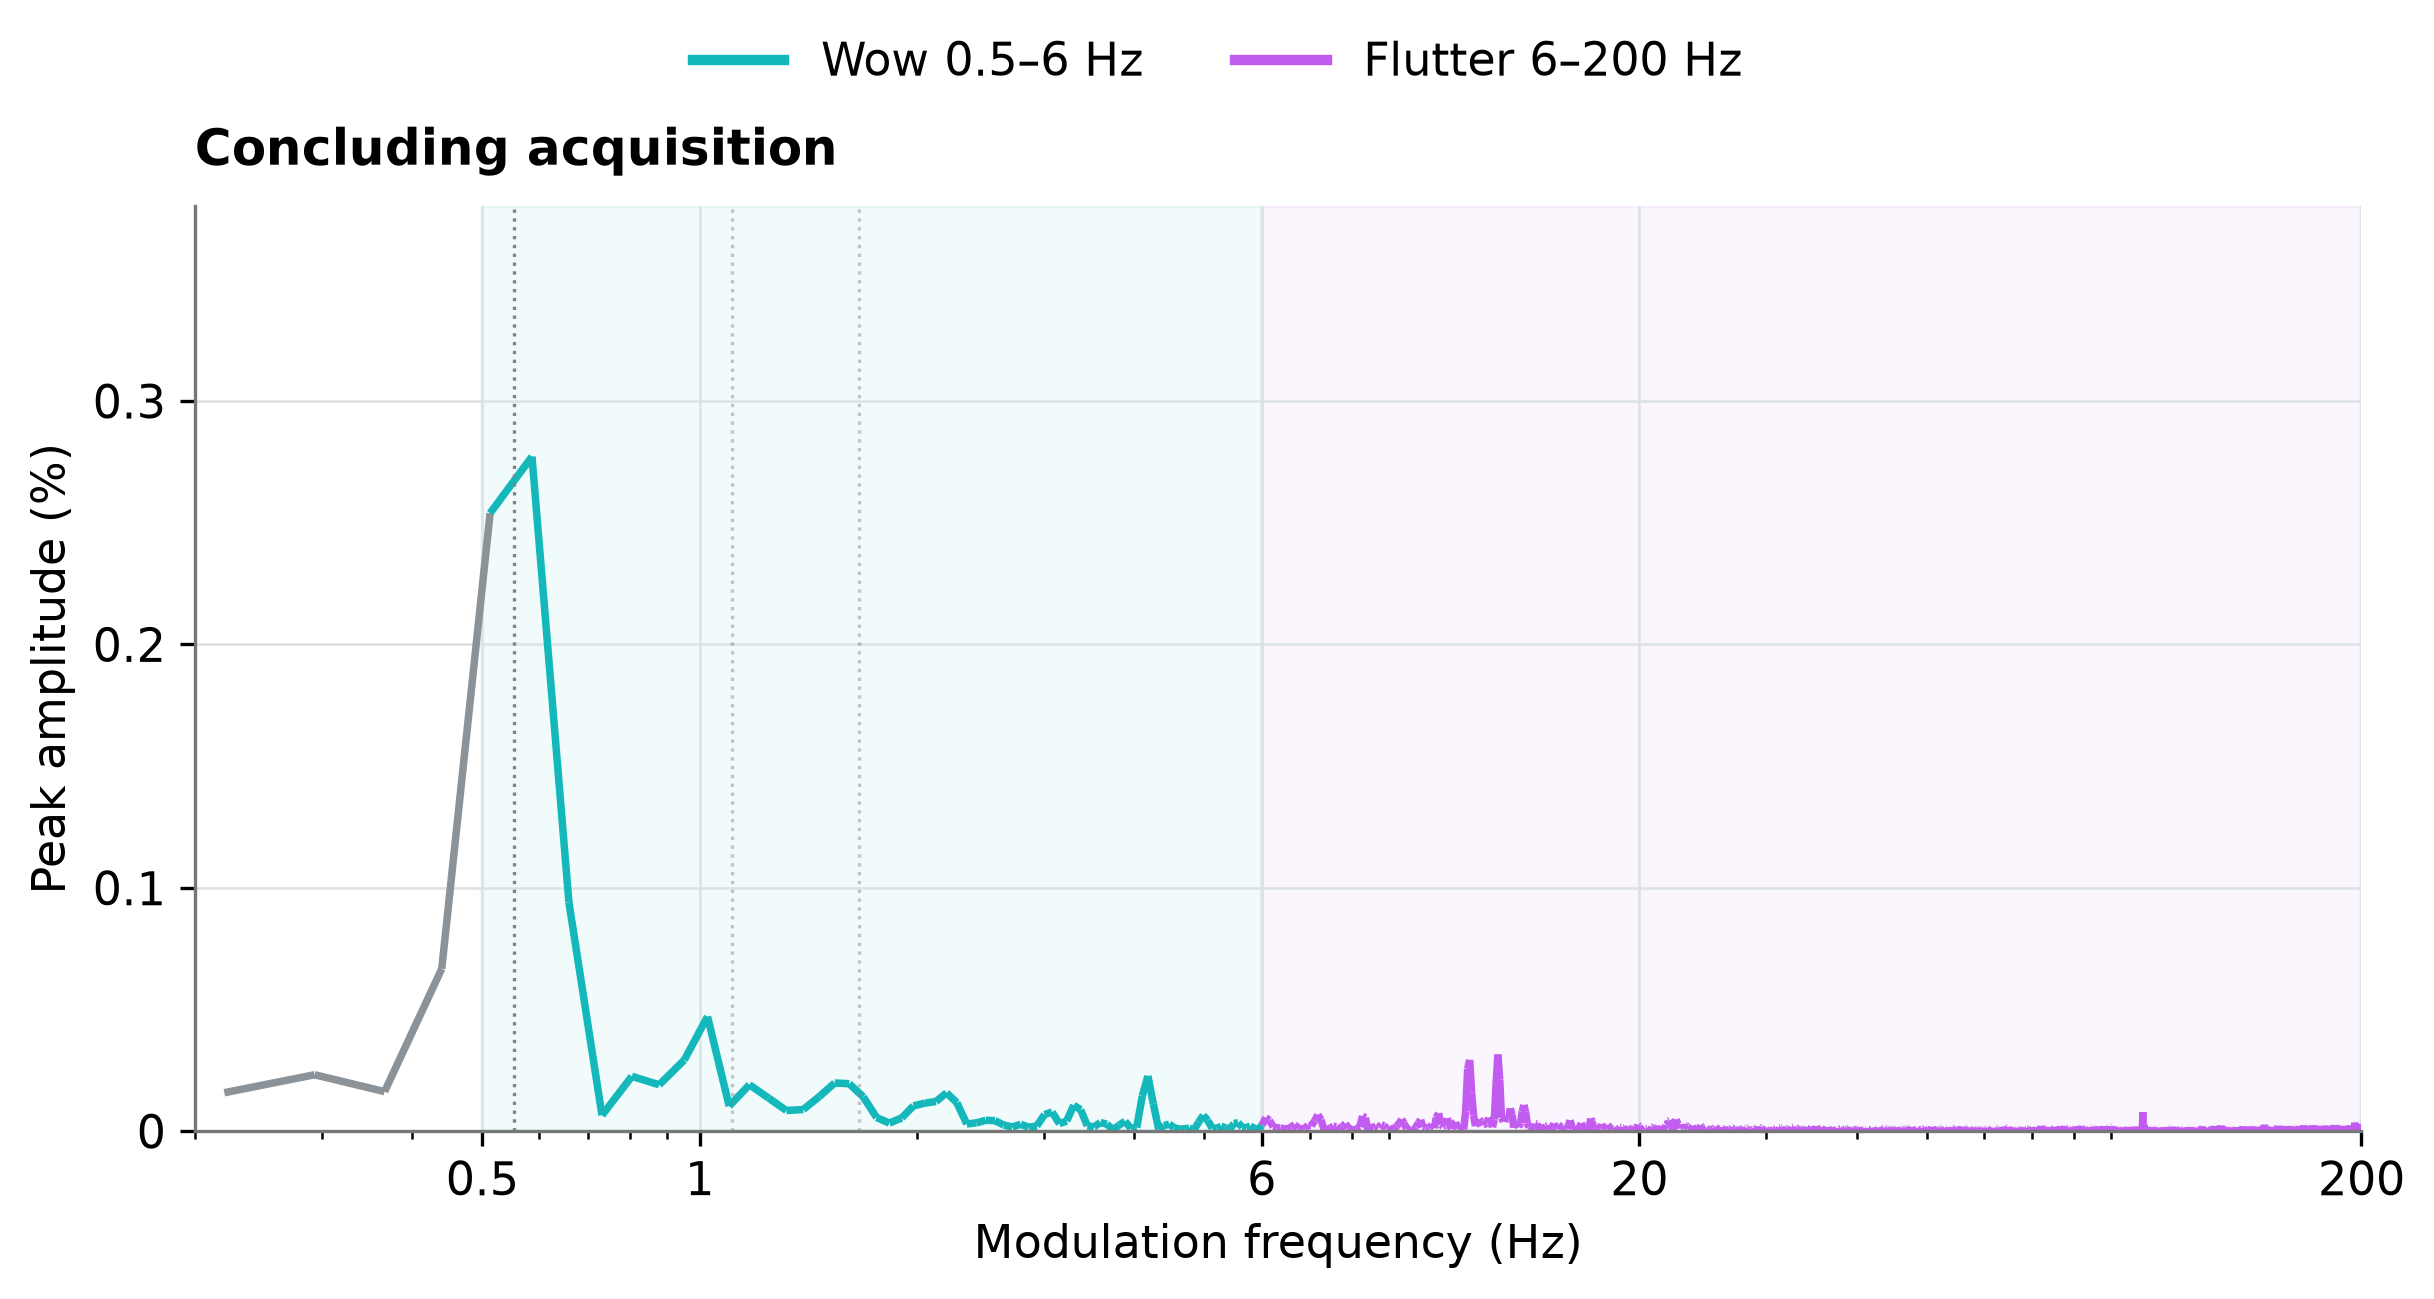
The concluding iPhone reference measurement corresponds to approximately 33.207 rpm, or −0.380% relative to 33⅓ rpm. This is a speed estimate derived from the reproduced tone, assuming that the recorded reference is exactly 1 kHz. It inherits the test record’s frequency accuracy and the capture clock’s accuracy.
Groove Scope and Groove Scope Studio also provide different descriptions of speed modulation. Each needs its own method label. A weighted RMS result and a weighted-peak result answer different questions and cannot be exchanged as if they were the same specification.
| Analysis mode | Concluding value |
|---|---|
| Groove Scope · DIN-shaped RMS | 0.0354% |
| Groove Scope Studio · unweighted RMS 0.5–200 Hz | 0.2383% |
| Groove Scope Studio · weighted RMS | 0.0914% |
| Groove Scope Studio · AES6-based weighted peak | ±0.1675% |
The phone and iPad results come from distinct concluding captures. For each Studio index, the larger of the two track values is reported. The ± sign follows the software’s weighted-peak statistic.
The main spectral peak is near 0.586 Hz, consistent within the roughly 0.082 Hz resolution with a once-per-revolution component. In the concluding capture, wow RMS was approximately 0.217–0.234% across the two tracks, compared with 0.045–0.048% flutter RMS. Slow modulation dominated. A component tied to the revolution can include disc eccentricity, so this observation does not isolate the motor or drive mechanism.
DIN-shaped RMS describes the phone’s frequency shaping and RMS detector. Studio’s weighted and unweighted indices use their respective processing. These analyses used a 1 kHz carrier, with about 12.2 seconds of useful observation per iPad track; they should retain that diagnostic context when compared with specifications obtained by a standardised 3150 Hz procedure.
Frequency response and the ART phono stage
The Groove Scope Studio sweep retained 111 points per channel, covering approximately 819 Hz to 19.6 kHz. It was normalised separately at 1 kHz for each channel. Studio numerically removed the ideal Standard RIAA response assumed for the phono stage, because Ortofon describes the sweep as a linear cut without recording RIAA.
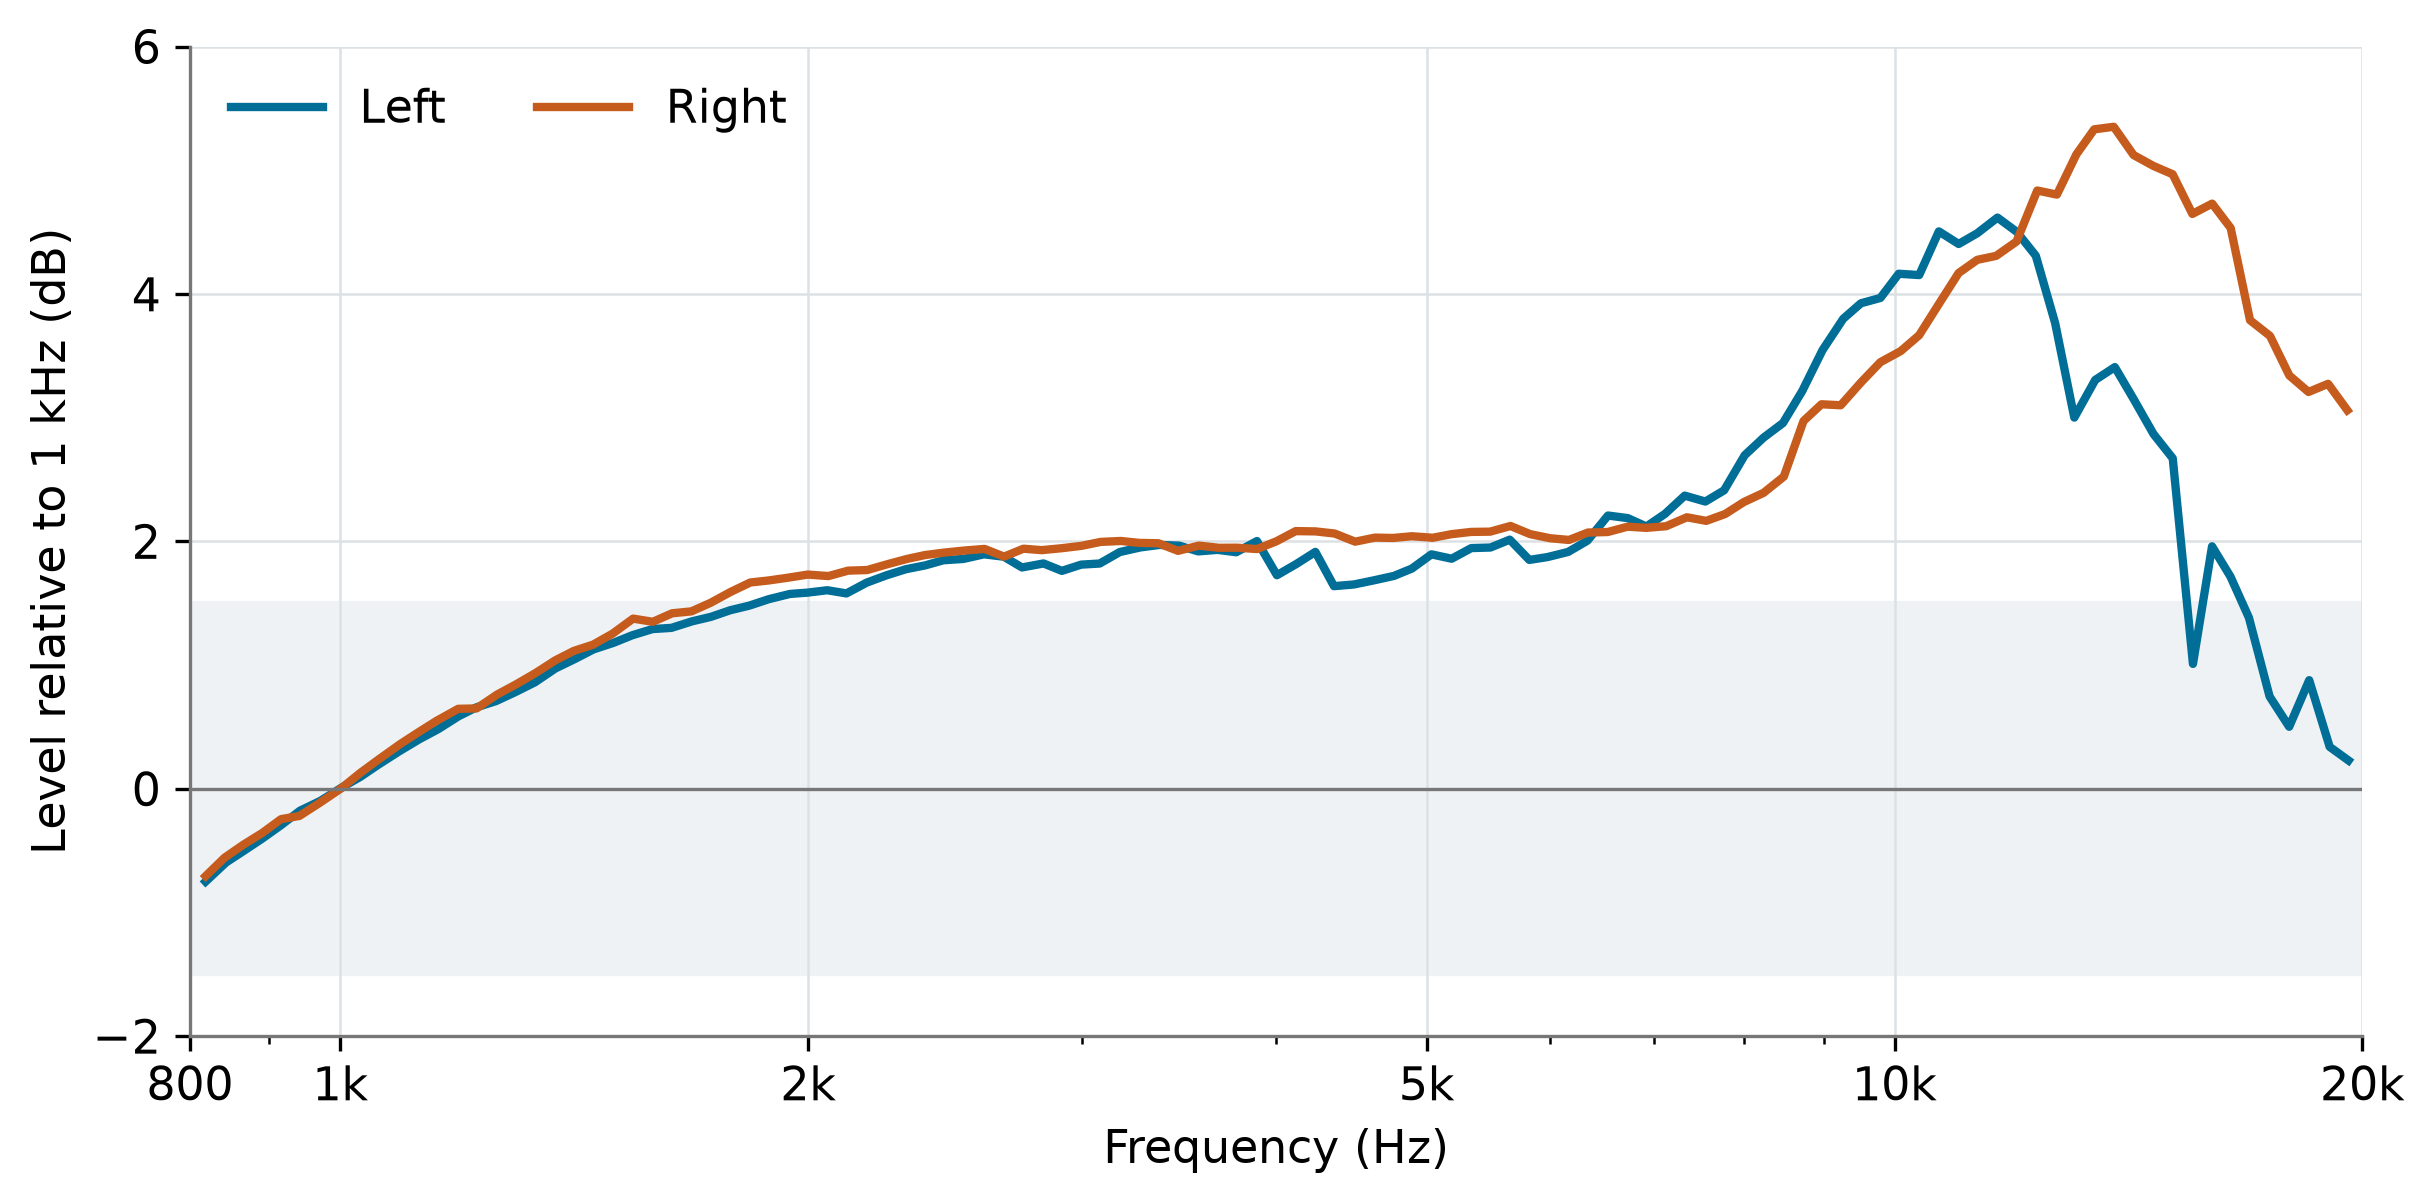
Both channels were approximately 2 dB above the reference around 5 kHz. The left peak reached +4.62 dB near 11.65 kHz; the right reached +5.35 dB near 13.83 kHz. The recorded maximum-to-minimum spans were 5.37 and 6.06 dB respectively. Near 19 kHz, the closest points were approximately +0.34 dB left and +3.27 dB right.
The close crosstalk symmetry at 1 kHz therefore did not imply matching response in the highest octave. Separate normalisation also removes the absolute level difference between channels, so this graph describes response shape rather than output balance.
The ART’s nominal phono load is 47 kΩ in parallel with 100 pF. Cable and stray capacitance add to that figure. In a moving-magnet system, generator inductance and total capacitance interact, potentially creating a high-frequency rise followed by a roll-off. Loading is a plausible contributor to the observed curve, but the available data do not establish how much of the rise it caused.
The original Rega cable’s actual capacitance was not measured. The ART’s PHONO-to-USB response was not electrically calibrated either. Ideal RIAA removal therefore leaves the response of the actual cartridge, cables and acquisition path together. LOW CUT was off and cannot account for a rise around 10–14 kHz.
What this tells us about the Carbon
The Carbon belongs to the affordable end of cartridge design. Its measured mean separation approaching 32 dB after adjustment is a favourable result on this sample. The remaining distortion, the upper-frequency rise and channel divergence, and the practical tracking boundary describe other aspects of its performance that separation alone cannot summarise.
Azimuth adjustment made better use of the available isolation. Increased tracking force reduced distortion under demanding modulation. Neither adjustment changed the cartridge’s basic generator or conical stylus. A more advanced cartridge would need to demonstrate its benefits in comparable measurements of response, distortion and tracking, rather than being assumed superior from its price.
A practical setup sequence
- Establish mechanical alignment and a tracking force within the cartridge manufacturer’s range, then document the complete capture chain.
- Measure both directions of crosstalk and channel levels. Check separation and symmetry together when evaluating an azimuth intervention.
- Recheck distortion and tracking after the change. A better separation result does not guarantee improvement elsewhere.
- Repeat the relevant captures and retain the original results, so that setup decisions can be distinguished from capture-to-capture variation.
This is where the measurement workflow becomes useful: it allows a particular adjustment to be connected with a particular result. For a broader explanation of how we preserve measurement context, see the DSR Vinyl Playback Fingerprint method. This case study does not claim acquisition under its complete controlled-comparison protocol.
Conclusions
The Planar 1 and its standard Carbon cartridge offered worthwhile scope for setup on the tested sample. At 2 g, the azimuth intervention reduced directional crosstalk asymmetry from 9.86 to 0.36 dB and raised mean separation from 28.65 to 31.95 dB. The initially weaker direction improved by 8.05 dB. That is a meaningful result from the supplied cartridge.
The separate tracking test showed a second useful improvement: 2.5 g reduced distortion on the stronger modulation bands, with 80 µm retained as the practical upper limit at the onset of error. Final 1 kHz THD of about 1.25% left and 1.96% right, and the unequal high-frequency response, place the separation result in perspective.
The speed-derived estimate was slightly slow, while the rotational spectrum was dominated by a low-frequency component close to one revolution. Those findings deserve to be read with the test record and capture method in view. They do not provide a standalone motor-performance verdict.
Taken together, the results describe an accessible playback system that rewards careful adjustment while retaining identifiable limits. The useful upgrade in this experiment was better knowledge of the system already on the shelf: what could be improved through setup, what remained a cartridge or chain limitation, and which further measurements would make the next decision more informed.
Continue exploring
Learn more about Groove Scope and its measurement workflow, explore the DSR measurement archive, or read the companion study on tonearm, cartridge and support interactions on a Rega Planar 3.