


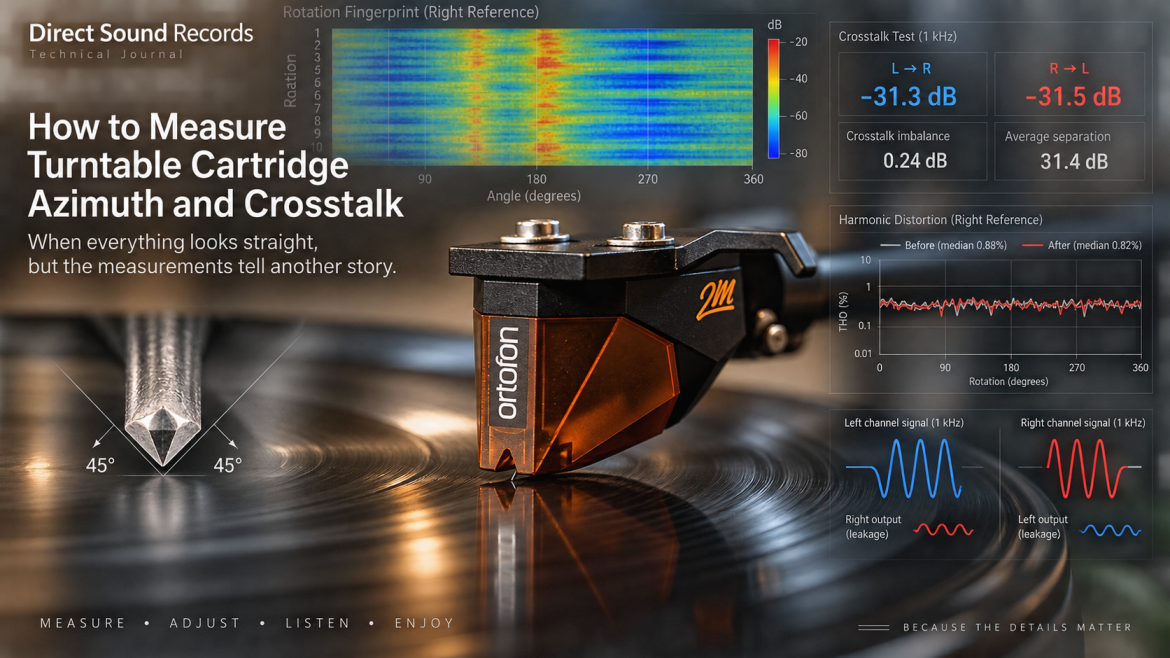
How to Measure Turntable Cartridge Azimuth and Crosstalk
https://directsoundrecords.com/wp-content/uploads/2026/10/Measuring-Cartridge-Azimuth-and-Crosstalk-1024x576.png 1024 576 Michelangelo Michelangelo https://secure.gravatar.com/avatar/89c9d8d7e3cacdd3a1530cf562ec5e1b4de2198dbb8a6dd62b550b23ac888854?s=96&d=mm&r=gWhen everything looks straight, but the measurements tell another story.
There is something rather satisfying about aligning a cartridge.
You place the protractor on the turntable, carefully lower the stylus onto the grid, look at the cartridge from above, then from the front. Perhaps you use a magnifying glass, or take a photograph with your phone because your eyes are no longer quite as cooperative as they used to be.
You move your head slightly to the left. Then to the right. You find a better light. Perhaps you enlarge the photograph on the screen and draw a line through the cantilever.
A little adjustment here. Another there.
Eventually, the cartridge looks straight, the cantilever appears perfectly aligned, and you convince yourself that everything is as it should be.
Excellent.
But is it?
I have been asking myself this question for some time. Not because I distrust the traditional methods of turntable cartridge alignment. Quite the opposite. They are essential, and I have used them for years.
The problem is that we tend to assume that what looks mechanically correct must also behave correctly when the stylus enters the groove.
And that is not necessarily true.
We can spend an extraordinary amount of time making sure that a cartridge is correctly positioned, that the overhang is accurate, that the tracking force is appropriate and that the tonearm is properly adjusted. All perfectly reasonable things to do.
Yet there is one question that our eyes cannot answer.
What is the cartridge actually doing electrically while the stylus is tracing the groove?
And, perhaps more importantly, how do we know?

Close-up of the Ortofon 2M Bronze mounted on the turntable, with the stylus resting on a record.
The geometry we can see, and the geometry we cannot
Before going any further, we need to understand what we are actually trying to align.
A stereo record contains two channels of information encoded into a single groove. The groove walls are oriented at approximately 45 degrees to the record surface, forming the familiar 90-degree V-shaped groove.
As the stylus follows the groove, its movement is transmitted through the cantilever to the cartridge generator, where that mechanical movement becomes an electrical signal.
Simple enough in principle.
But the stylus is not just a small point resting at the bottom of the groove. It contacts the groove walls through carefully shaped surfaces, and the orientation of those surfaces matters.
One of the parameters involved is called azimuth.
In practical terms, azimuth describes the side-to-side angular orientation of the stylus relative to the groove. Viewed from the front, imagine a line passing through the stylus. Ideally, the stylus contact geometry should be correctly oriented relative to the two groove walls.
Now consider the cartridge itself.
The body may be perfectly horizontal. The cantilever may appear straight. Yet the stylus might not be mounted at precisely the angle we expect.
Manufacturing tolerances exist, even in good cartridges. The stylus, cantilever, suspension and generator are separate elements assembled into a very small mechanical system.
And the cartridge’s electrical generator introduces another consideration: its channel axes may not correspond perfectly to what we see when looking at the cartridge body.
This means that physical alignment, stylus alignment and electrical channel separation are related, but they are not interchangeable.
A perfectly horizontal cartridge body does not guarantee perfect electrical separation.
Equally, the azimuth position that produces the best electrical separation is not automatically proof that the stylus contact surfaces are geometrically ideal.
That distinction is important, especially when deciding how far we should adjust a cartridge.
Front-facing cross-section of a stereo record groove showing the two 45-degree groove walls, the stylus and the left/right channel directions. A second illustration compares correct stylus orientation with a slightly tilted stylus.
When two channels are not quite independent
To understand why azimuth matters, we need to introduce another term: crosstalk.
Ideally, when a record contains information intended only for the left channel, the cartridge should reproduce that information exclusively through its left output.
In reality, some of the signal appears in the opposite channel.
That unwanted contribution is called crosstalk.
The same happens in the other direction.
If we play a signal recorded only in the left channel, we can measure how much appears in the right. We call this L→R crosstalk.
Then we repeat the test with a signal recorded only in the right channel and measure the leakage into the left: R→L.
The result is usually expressed in decibels relative to the signal in the intended channel.
For example, a crosstalk value of −30 dB means that the unwanted signal has a voltage amplitude approximately 31.6 times smaller than the wanted signal, assuming comparable measurement conditions.
The more negative the value, the better the separation.
Manufacturers often express the same concept as positive channel separation. Thus, −30 dB crosstalk corresponds to 30 dB separation.
So far, nothing particularly mysterious.
But there is a detail that is often overlooked.
The two directions do not necessarily produce the same result.
We might measure −30 dB from left to right and only −25 dB from right to left.
Why?
Several factors may contribute, including generator geometry, mechanical alignment, differences in the recorded test signals and the measurement chain.
A difference does not automatically prove that the stylus is tilted. But it tells us that the complete playback system is not behaving identically in both directions.
And that is useful information.
It also introduces a question that becomes central to our experiment.
Should we adjust azimuth to maximise channel separation, or should we try to make the two directions as similar as possible?
Perhaps the answer is neither.
Or, more precisely, perhaps we need to consider both.

Two simplified signal paths. First, a left-only 1 kHz signal with a strong left-channel waveform and a much smaller right-channel waveform. Second, the reverse. Label L→R and R→L clearly.
From looking to measuring
For this experiment, I used an Ortofon 2M Bronze cartridge and a test record containing the necessary 1 kHz channel signals.
The electrical output was captured through an Audient EVO4 audio interface and analysed using Groove Scope.
The principle is straightforward.
We reproduce a known signal, capture the electrical output and compare the amplitude of the intended channel with the amplitude appearing in the opposite channel.
We then repeat the procedure in the other direction.
What matters is that the measurements are taken under comparable conditions. We want to investigate the cartridge, not changes introduced by different gain settings, routing or measurement procedures.
Groove Scope gives us the two crosstalk measurements, their difference, average separation and additional diagnostic information.
This is useful because it allows us to evaluate the complete result rather than chasing a single number.
And the first measurement gave me something worth investigating.
The first surprise
The initial results were:
| Measurement | Initial result |
|---|---|
| L→R crosstalk | −29.0 dB |
| R→L crosstalk | −24.6 dB |
| Crosstalk imbalance | 4.32 dB |
| Average separation | 26.8 dB |
| Left/right output balance | +0.25 dB |
At first glance, these are not disastrous figures. We are still talking about a cartridge providing useful stereo separation.
But look more closely.
One direction is performing substantially better than the other.
The left-to-right result is reasonably strong, while the right-to-left result is noticeably weaker.
And here comes another interesting detail.
The measured output-level balance between left and right was only +0.25 dB.
So the cartridge was delivering very similar output levels from the two channels, despite the difference in their electrical separation.
This is a useful reminder that channel balance and channel separation are not the same thing.
A cartridge can have excellent left/right output balance while showing a significant difference in crosstalk.
If we relied only on the relative loudness of the two channels, we might never notice the separation asymmetry.
The measurement had revealed something that was not obvious from the visual alignment or the channel levels.
But what should we do with that information?

Initial Groove Scope diagnostic showing 4.32 dB more leakage into the left channel, before the azimuth adjustment.
A small adjustment, a rather different result
The next step was to investigate whether changing the cartridge’s azimuth could improve the measured behaviour.
This is where I believe measurement becomes genuinely valuable.
Without an instrument, we might make a tiny adjustment, listen to a familiar record and try to decide whether something has changed.
Perhaps it sounds better. Perhaps not.
The difficulty is that small differences are notoriously difficult to evaluate reliably when we are also expecting to hear an improvement.
With a measurement, we can at least establish whether the electrical behaviour has changed in a direction we consider beneficial.
After adjusting the cartridge’s azimuth, I repeated the test.
The second results were:
| Measurement | Before | After |
|---|---|---|
| L→R crosstalk | −29.0 dB | −31.3 dB |
| R→L crosstalk | −24.6 dB | −31.5 dB |
| Crosstalk imbalance | 4.32 dB | 0.24 dB |
| Average separation | 26.8 dB | 31.4 dB |
| Left/right output balance | +0.25 dB | +0.16 dB |
Now this was interesting.
The original 4.32 dB imbalance had almost disappeared.
But even more importantly, both directions had improved.
The L→R result improved by 2.3 dB.
The R→L result improved by 6.9 dB.
Average separation increased by 4.6 dB.
That is not simply a matter of exchanging performance in one channel for performance in the other.
The measured electrical separation improved overall, and the two directions became much more closely matched.
In other words, the new setting produced a better electrical result according to both criteria.
This is exactly the kind of result that makes an experiment satisfying.
We began with a question, made an adjustment, repeated the measurement and obtained a clear difference.
The cartridge had given us an answer.

Second Groove Scope diagnostic showing 0.24 dB crosstalk imbalance and the close match between the two channels.

Comparison chart showing L→R and R→L separation before and after the adjustment, with average separation increasing from 26.8 dB to 31.4 dB. Use positive separation values for clarity.
Why the best number is not always the best adjustment
At this point, it would be tempting to conclude that we simply need to adjust every cartridge until both crosstalk measurements are identical.
Unfortunately, things are rarely quite so convenient.
Imagine that we adjust a cartridge and obtain −35 dB in one direction but only −22 dB in the other.
We have achieved an excellent result for one channel, but at the expense of the other.
Now imagine another setting that gives us −30 dB in both directions.
Which is better?
For practical electrical separation, the second result may well be preferable, because neither channel is being significantly compromised.
But we must also remember that electrical separation is not a direct measurement of the stylus contact geometry.
The cartridge generator, the stylus assembly and the groove form a complex mechanical and electrical system.
It is possible to obtain a very attractive crosstalk balance at an azimuth setting that is not geometrically ideal for the stylus.
This is particularly relevant with more sophisticated stylus profiles, where the orientation of the contact surfaces matters.
So I would not recommend using crosstalk as an excuse to tilt a cartridge excessively.
Visual alignment remains an important starting point.
The aim is to find a sensible practical setting that respects the mechanical geometry while achieving good, repeatable electrical performance.
And in our experiment, the encouraging observation was that the improved crosstalk balance came together with better separation in both directions.
That is a considerably more persuasive result than balance alone.
There was another change hiding in the measurements
So far, we have concentrated on channel separation.
But Groove Scope also captured harmonic distortion information during the experiment.
And here we find another interesting observation.
In the initial measurement, total harmonic distortion was 0.81% on the left and 0.85% on the right.
After the adjustment, it was 0.78% and 0.83% respectively.
These are small changes in absolute percentage terms.
However, the direction of the change is worth noticing.
Both channels showed slightly lower measured distortion after the adjustment.
Now, a single pair of measurements would not be enough to establish a general rule about azimuth and harmonic distortion.
But the Rotation Fingerprint comparison adds another perspective.
Rather than relying only on one aggregate result, it examines the behaviour across consecutive platter rotations and produces median profiles.
In that comparison, the left-reference median THD remained essentially unchanged at 0.79%.
The right-reference median moved from 0.88% before the adjustment to 0.82% afterwards.
This is particularly interesting because the right-reference measurement was also the direction in which the crosstalk performance had been weaker before the adjustment.
We now have two observations associated with the changed setup: substantially improved electrical separation and a lower right-reference median distortion result.
The evidence is not sufficient to prove that azimuth alone caused the distortion change. Groove Scope itself identifies limitations in the strength of that comparison.
Nevertheless, I would not dismiss it.
It is a measurable difference that occurred alongside the azimuth adjustment, and it provides a good reason to investigate further.
Sometimes the value of a measurement is not that it gives us a definitive answer.
Sometimes it tells us where to look next.
[IMAGE 07 — THD FINGERPRINT COMPARISON, LEFT REFERENCE]
Before-and-after median THD profile for the left reference. The median remains approximately 0.79% in both measurements.
[IMAGE 08 — THD FINGERPRINT COMPARISON, RIGHT REFERENCE]
Before-and-after median THD profile for the right reference. The median decreases from 0.88% to 0.82% after the adjustment.
What happens during one revolution?
There is another reason I find the Rotation Fingerprint analysis fascinating.
A conventional measurement often gives us one value that summarises what happened during the test.
That is useful, but it can conceal variations occurring over time.
A vinyl record is not a perfectly abstract signal source.
It is a physical object rotating beneath a mechanical pickup system. The stylus is continuously responding to the groove, while the cartridge, tonearm and record form part of the playback process.
Groove Scope’s Rotation Fingerprint presents measurements across successive platter revolutions.
Each row represents a rotation, while the horizontal axis follows the relative angular position around the record.
By comparing the rows, we can observe whether certain behaviours appear consistently at similar positions.
In the supplied leakage fingerprints, the patterns are visibly different between captures and between reference channels.
Some show more pronounced regions of variation. Others appear considerably more uniform.
It is important not to interpret every variation as a cartridge problem.
A recurring feature might be associated with the record, its groove modulation, pressing characteristics or other aspects of playback.
The fingerprint does not automatically tell us the cause.
But it gives us something that a single number cannot: a view of how the measurement behaves over successive revolutions.
And that opens an entirely new area of investigation.
If we observe a difference between two azimuth settings, is the change consistent throughout the rotation?
Does one channel behave differently at particular angular positions?
Are the results repeatable if we play the same passage again?
These are questions that deserve their own experiment.
For now, the important point is that the average crosstalk result and the rotation-dependent behaviour describe different aspects of the same playback system.
We should not confuse them.
[IMAGE 09 — ROTATION FINGERPRINT BEFORE ADJUSTMENT]
Leakage fingerprint from the initial measurement, preferably showing the right-reference pattern.
[IMAGE 10 — ROTATION FINGERPRINT AFTER ADJUSTMENT]
Corresponding leakage fingerprint from the second measurement. Place the two images side by side if the Journal layout allows it.
And then, finally, the music
Of course, there is a reason why we spend so much time adjusting turntables.
It is not because we particularly enjoy looking at numbers on a screen.
Well, perhaps some of us do.
But ultimately, the objective is to listen to music.
After completing the adjustment, I returned to familiar records.
The same cartridge. The same turntable. The same system.
And the presentation had changed.
There was a greater sense of air around the instruments, a more clearly defined stereo image and a soundstage that seemed to open up beyond what I had experienced before.
The instruments occupied their own positions more convincingly. The presentation felt more spacious, with a greater sense of separation and ease.
These are listening impressions, of course, not measurements.
I cannot take a 4.6 dB improvement in average electrical separation and translate it directly into a specific improvement in perceived soundstage width.
Nor can I claim that the small measured change in harmonic distortion explains everything I heard.
Listening is more complicated than that.
But I find the sequence of events compelling.
I began with a cartridge that appeared correctly aligned.
The initial measurement revealed unequal crosstalk.
I changed the azimuth and repeated the experiment.
Both directions of electrical separation improved, the crosstalk imbalance almost disappeared, and the distortion measurements provided some additional encouraging observations.
Then I listened.
And I preferred the result.
That does not turn a listening impression into a laboratory proof. But it does give the experiment a satisfying conclusion.
The measurements guided the adjustment. The listening experience gave it meaning.
The turntable playing a record in the actual listening environment. A warm, personal photograph that moves the article away from graphs and back to music.
When straight is not necessarily right
So what did we learn?
First, that visual cartridge alignment remains essential, but cannot tell us everything about electrical performance.
Second, that left/right output balance and channel separation are different measurements. A cartridge can reproduce both channels at almost identical levels while allowing considerably more information to leak from one channel into the other.
And third, perhaps the most interesting discovery of all, that a very small azimuth adjustment can produce a rather